 LAST PAGE
 RETURN TO INDEX
RESISTIVITY SURVEY
RES 5
Part Forty-seven

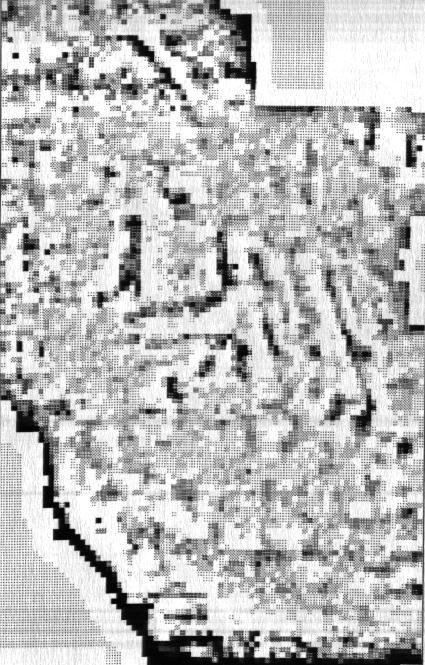
Shade Plot (Clip) Min -4 Max 4 Contrast 1 Units Absolute
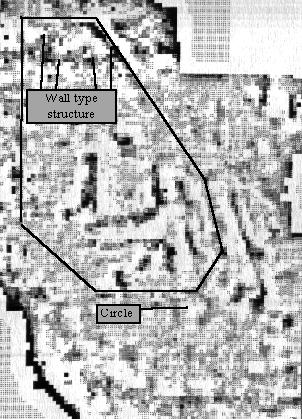
 In order to better evaluate the data it is possible to present it using a clip filter. This displays the data within the chosen parameters in a way that can emphasise subtle changes that might not be otherwise seen. In this case it removes most of the shadows providing a much clearer image of the fort perimeter boundary with the earlier indistinct Iron Age boundary. In the northern section detail has started to emerge with linear images of high resistivity (dark) indicating a wall structure where the mound is located. A pale circular image has appeared just below the bottom of the fort area whilst the image of the ditches have been bought into much clearer focus.
Looking carefully to the left of the Keep there is an area of speckled high resistivity, which might indicate another wall. In order to examine this and the area around the mound the data was reprocessed using just the material 60 meters wide by 100 meters deep, starting in the top left hand corner.
NEXT PAGE
 RETURN TO INDEX


 LAST PAGE
 RETURN TO INDEX
