 LAST PAGE
 RETURN TO INDEX
RESISTIVITY SURVEY
Part Forty-three
A survey was carried out by myself and a series of willing, and not so willing, students of the art of learning about resistivity surveying between August 1993 and Summer 1994. Most of this was done in the Autumn before the valley flooded and Spring after the water levels had dropped. During the high Winter months the ground around the camp site was almost completely waterlogged. In fact one November day I managed to get the tractor carrying our equipment completely stuck in the entrance to the fort field. Even when a huge farm tractor came to our rescue, three hours later, there was a period of at least an hour when it looked like we were both in need of rescue. As we sat there wondering what to do, stuck in the middle of no-where, my mind went back to that event in Poitiers manuscript where William dismounted because of “the difficulty of the ground” at their camp site. Three hours soaked to the skin in two feet of mud brings home the meaning of those words with a vengeance.
The survey was conducted using an RM4 resistivity survey kit kindly loaned to me by the Hastings Area Archaeological Research Group. The plot was mapped out in twenty meter squares with one reading to each meter. The survey site was 560 meters long by 320 meters wide covering the complete Norman fort area. There is an additional section below the hedge line in Sandrock Field, to the south, which was 60 meters by 60 meters. This later segment was only recently added and still requires completing. Where appropriate I have shown two plans of each plot. One is the print from the computer and one where the feature we are looking at is marked. In common with the photographic prints there is a loss of quality attributable to the transfer process. The original plots are available for inspection during normal work hours at my office.
RES1

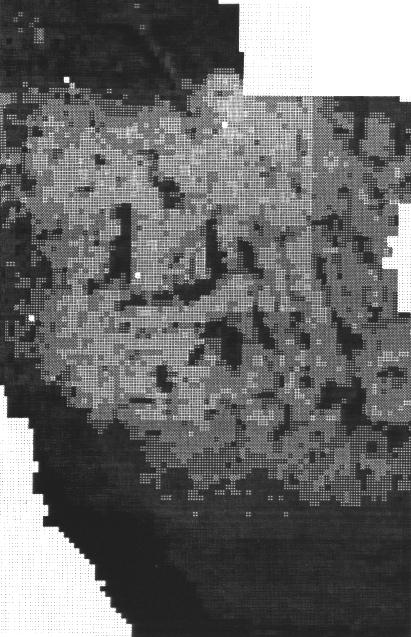
Shade Plot (Clip) Min -1 Max -1 Contrast 1 Units Std.Dev

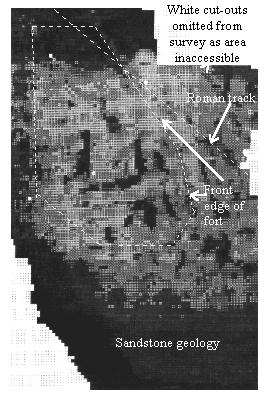
All plots are looking north to coincide with the photographs earlier. The first plot (RES1) above shows the raw resistivity data with underlying geology. Dark areas are high resistivity indicating the sandstone outcrop which surrounds the site. High resistivity is the characteristic which we are looking for since hidden artefacts produce the same dark image. It is therefore necessary to process the data to remove natural high resistivity using computer filters. The central area shows the main ditch of the fort (lighter line)cutting through the area of high resistivity in the top right hand corner of the fort area. Low resistivity is demonstrated by lighter areas. These indicate an absence of background readings with ditches producing the lowest readings on a site and providing a good method of establishing man made ditch construction. Surprisingly there is an area of high resistivity shown in the central area of the fort, which looks like the clear outline of a building of some kind, even though there is absolutely no indication of anything on the surface. Three sides of a wall exist with possible rubble on the north side. The area just below the bottom right hand corner of the fort appears to contain something, although at this stage the data is not reliable. On the screen version the track crossing the top right hand side of the fort is visible and appears on the print as a line of speckled squares.
These results are very exciting since they provide conclusive scientific proof of the existence of a man made structure. Close examination shows the first signs of ditches running parallel to the front edge of the fort running along the eastern and southern boundaries. Further data processing now needs to be carried out. I therefore applied a high pass filter to remove the high readings caused by the background geology.
NEXT PAGE
 RETURN TO INDEX


 LAST PAGE
 RETURN TO INDEX
